



Image Gallery: SDSS Spectra
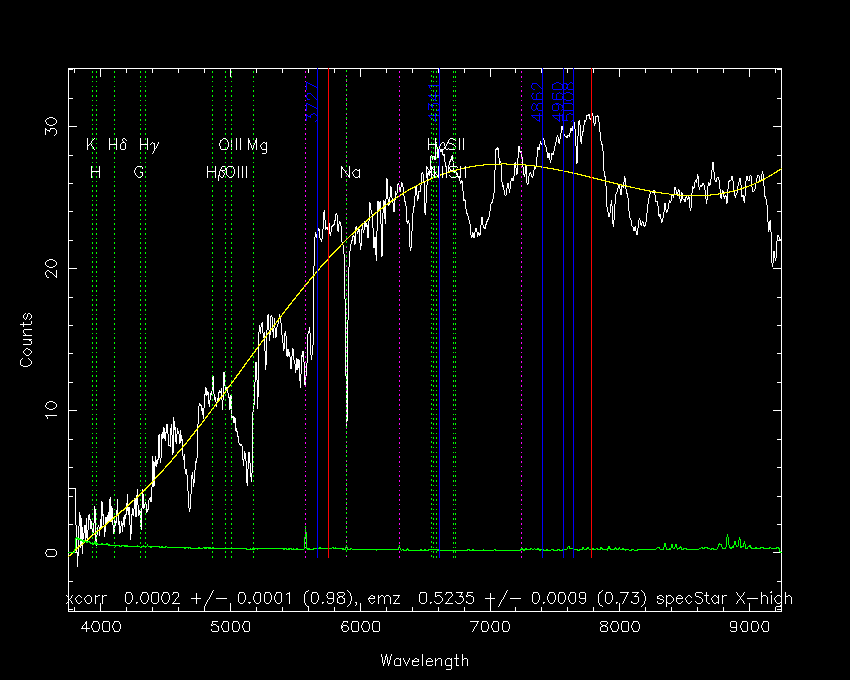
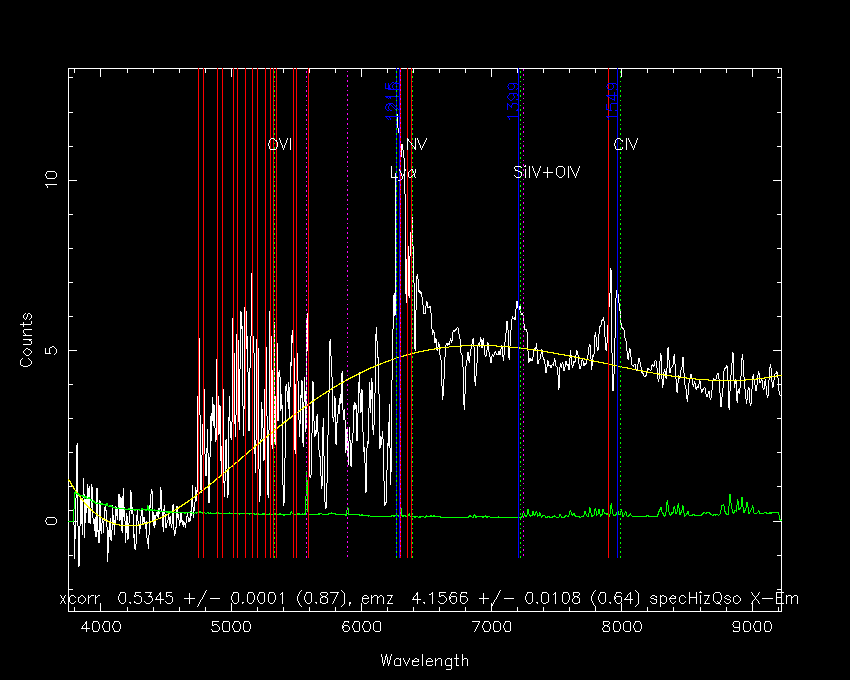
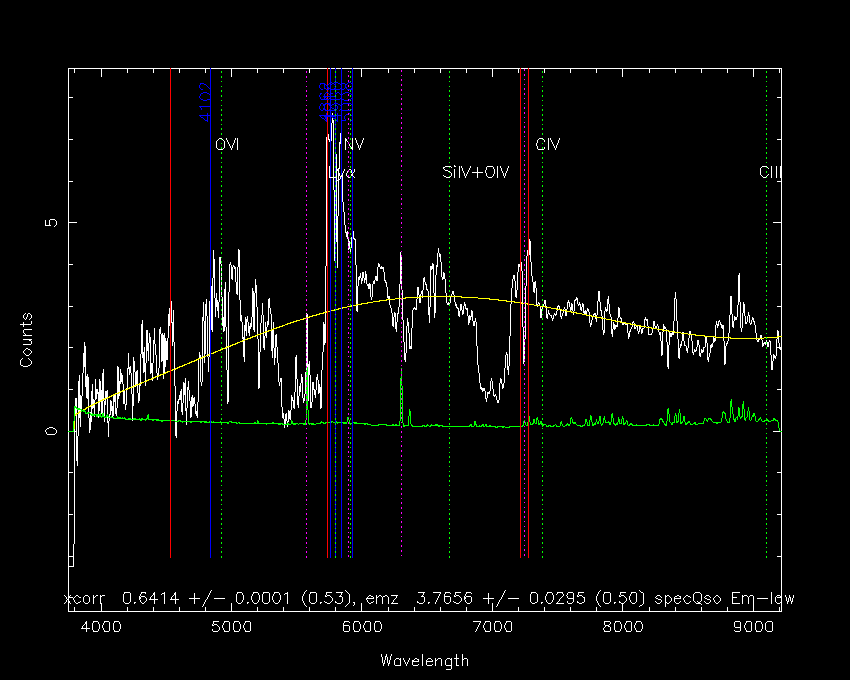
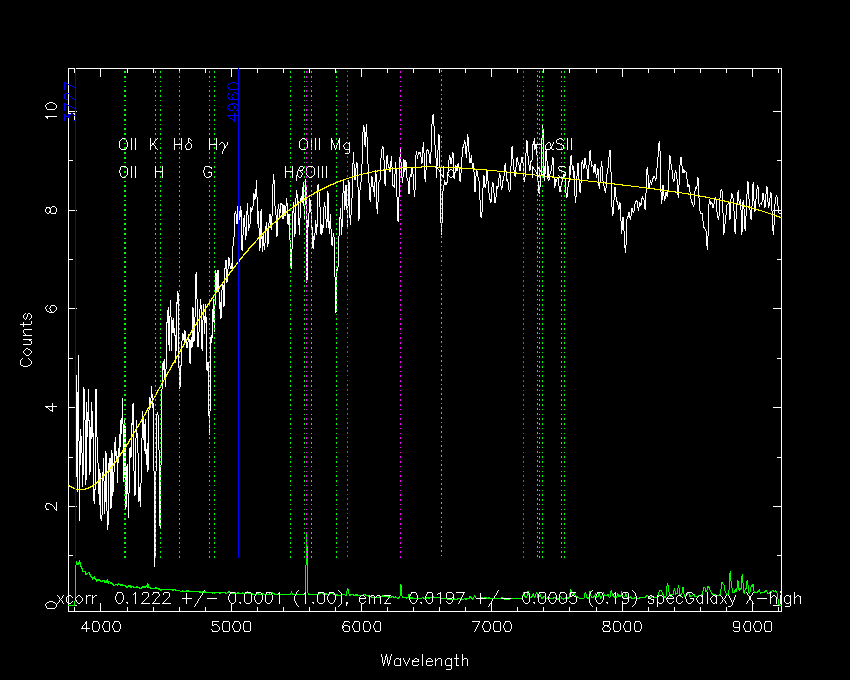
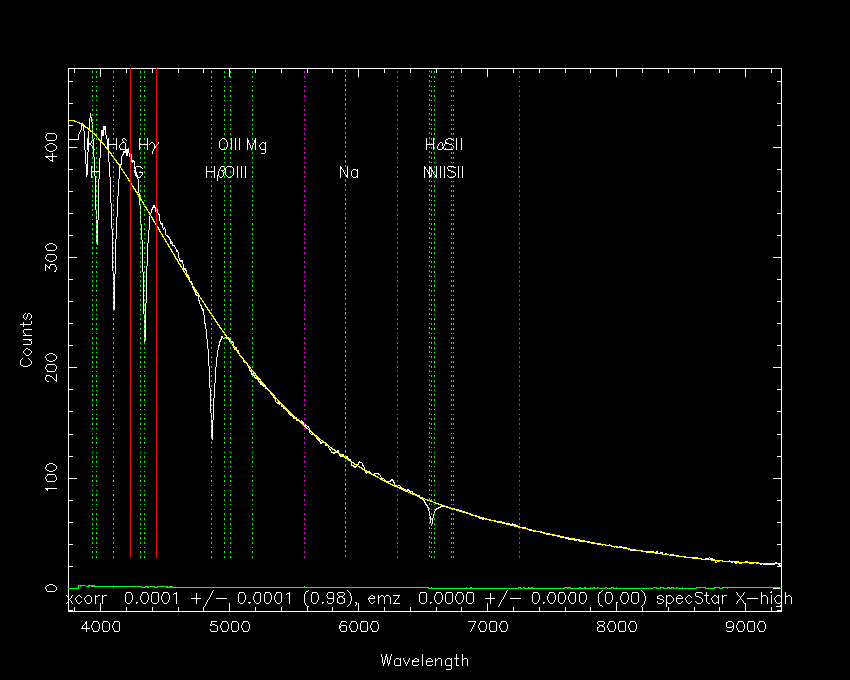
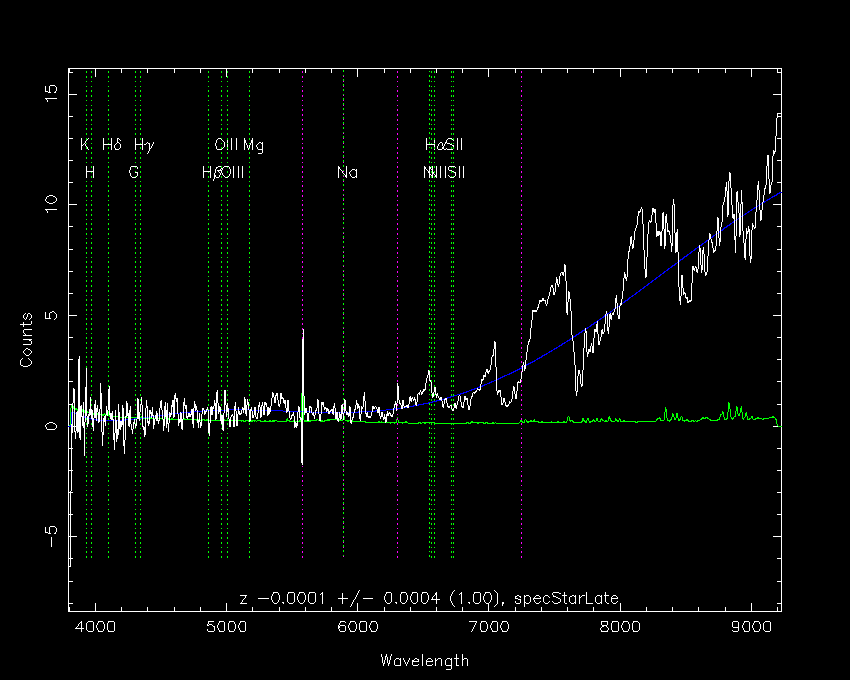
The following are examples of spectra obtained by the SDSS twin spectrograph at Apache Point Observatory. The spectra below have been processed by the SDSS 2D reduction software. The vertical lines in the spectra represent features identified by the SDSS 1D code. Dotted green lines correspond to either emission or absorption features fit by 1D. Solid blue lines indicate the location of strong emission features located by the code. Solid red lines show potential emission features that 1D failed to identify. Dotted magenta lines give the location of night sky lines. The yellow curve shows a smooth continuum for the spectrum while the lower green curve represents the error in the number of counts.
Click on any of the links below to download a larger version of the image thumbnails.
(Images and captions courtesy of Brian Wilhite, University of Chicago)
Quasars
 Redshift 4.16 QSO
[ PS (110.4 KB), 85 dpi GIF (23.9 KB) ]
Redshift 4.16 QSO
[ PS (110.4 KB), 85 dpi GIF (23.9 KB) ]
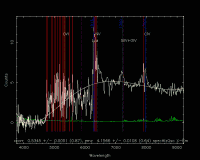
The spectrum of a QSO at a redshift (z) of 4.16. The emission line fitting algorithm correctly identified the redshifted Lyman alpha peak, as well as the nitrogen, silicon, oxygen and carbon emission features just redward. Note that the software regarded much of the Lyman alpha forest as unidentifiable emission lines, but still calculated a correct redshift. The Survey will obtain spectra for roughly 100,000 QSO's, although most will be at lower redshift than this one.
(Image credit: SDSS Collaboration)
 Redshift 3.7 QSO
[ PS (112.1 KB), 85 dpi GIF (19.6 KB) ]
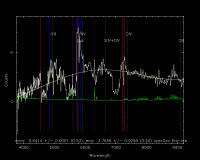
Redshift 3.7 QSO
[ PS (112.1 KB), 85 dpi GIF (19.6 KB) ]
A QSO with broad absorption at z~3.7. Again, 1d correctly identified the emission features, although the broad absorption caused an error of about 0.05 in redshift.
(Image credit: SDSS Collaboration)
Galaxies
 Typical galaxy
[ PS (127.7 KB), 85 dpi GIF (19.6 KB) ]
Typical galaxy
[ PS (127.7 KB), 85 dpi GIF (19.6 KB) ]
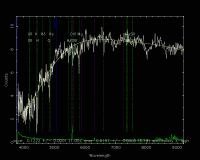
A galaxy at redshift 0.1234. These "typical" galaxies' redshifts are usually fit by identifying the calcium H and K lines in conjunction with the strong magnesium and sodium lines at 5178 and 5891 Angstroms, respectively. Strong absorption in hydrogen and the G band can also be seen in this spectrum. At the end of its run, the Survey will have spectra for approximately one million such galaxies.
(Image credit: SDSS Collaboration)
 Bright red galaxy
[ PS (125.5 KB), 85 dpi GIF (17.8 KB) ]
Bright red galaxy
[ PS (125.5 KB), 85 dpi GIF (17.8 KB) ]
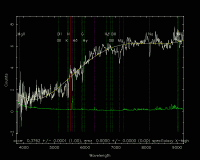
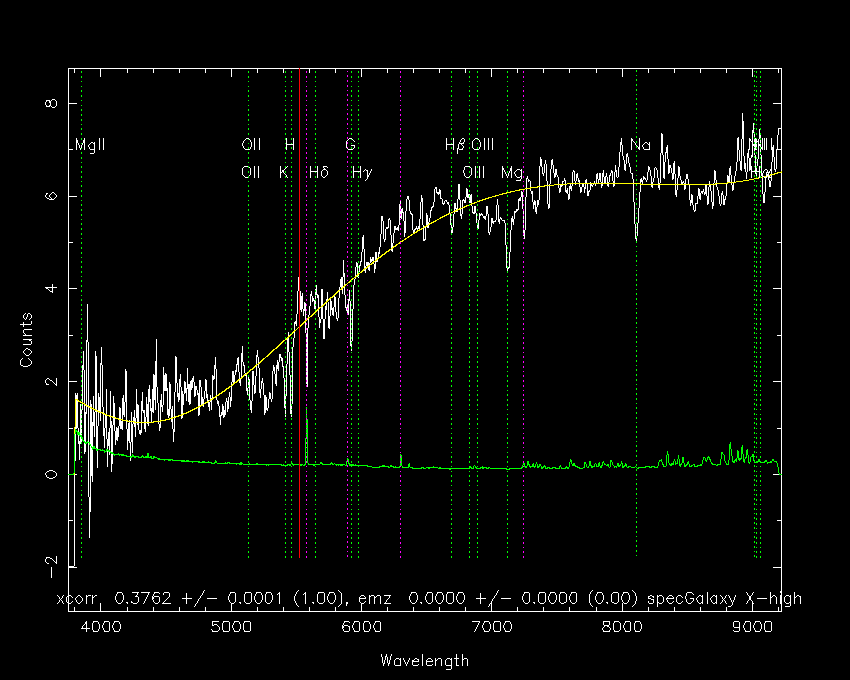
This is an example of an SDSS Bright Red Galaxy (BRG). These galaxies are typically elliptical galaxies at a redshift of 0.25 to 0.5, targeted for spectroscopy due to their red color in the imaging portion of the Survey. This galaxy, at a redshift of 0.3762, has especially prominent magnesium and sodium absorption.
(Image credit: SDSS Collaboration)
 Emission-line galaxy
[ PS (131.0 KB), 85 dpi GIF (16.2 KB) ]
Emission-line galaxy
[ PS (131.0 KB), 85 dpi GIF (16.2 KB) ]
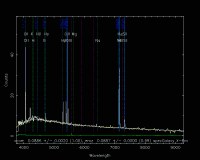
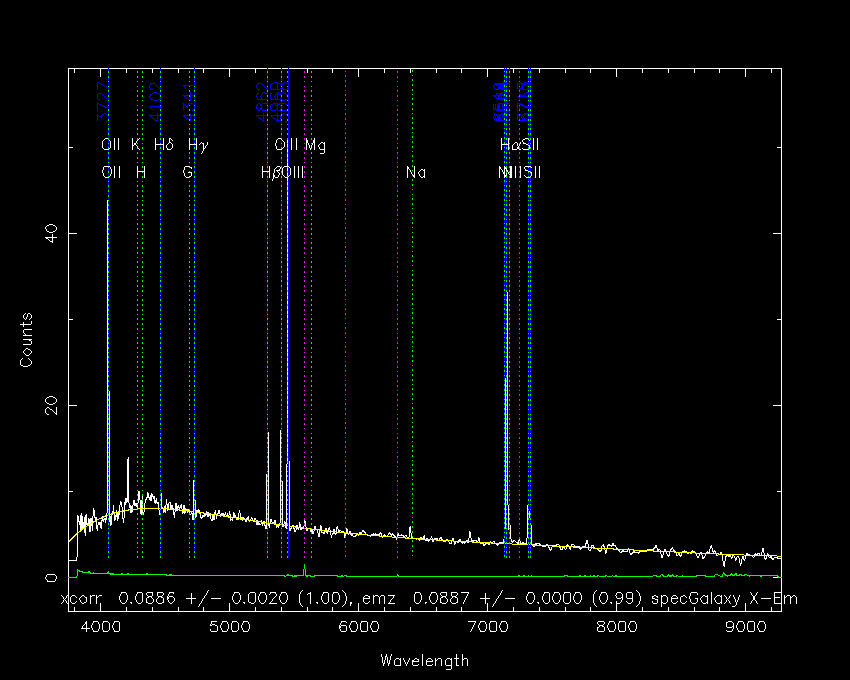
An emission-line galaxy with z=0.0886. The prominent features of such a galaxy are now in emission, not absorption. SDSS software fits the redshifts for these galaxies by identifying the various hydrogen, nitrogen II, sodium II, and oxygen III lines.
(Image credit: SDSS Collaboration)
Stars
 DA white dwarf
[ PS (126.7 KB), 85 dpi GIF (13.5 KB) ]
DA white dwarf
[ PS (126.7 KB), 85 dpi GIF (13.5 KB) ]
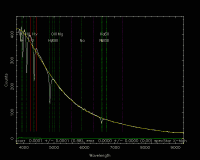
Although the SDSS is primarily an extragalactic survey, spectra will be obtained for some 100,000 stars. This is a typical DA white dwarf, as identified by its very broad hydrogen absorption features.
(Image credit: SDSS Collaboration)
 Cool red M star
[ PS (156.8 KB), 85 dpi GIF (14.6 KB) ]
Cool red M star
[ PS (156.8 KB), 85 dpi GIF (14.6 KB) ]
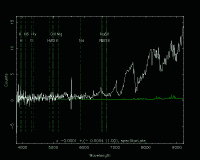
Many of the stars to be observed within the Survey are cool red stars such as this M star. These stars are easily identified by their low flux in the blue portion of the spectrum and clear titanium oxide absorption bands towards the red end.
(Image credit: SDSS Collaboration)
 Carbon star
[ PS (125.4 KB), 85 dpi GIF (19.7 KB) ]
Carbon star
[ PS (125.4 KB), 85 dpi GIF (19.7 KB) ]
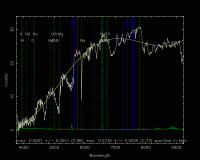
Through sheer number of objects observed, the SDSS will help advance the field of stellar astronomy. Here is an example of a carbon star, a "rare" star which lies away from the main stellar sequence. The strong absorption bands in the blue half of the spectrum are due to absorption by molecular carbon.
(Image credit: SDSS Collaboration)